Download CSV in Analyze
Stop manually copying analytics into spreadsheets. Export exactly what you need from Analyze in one click.
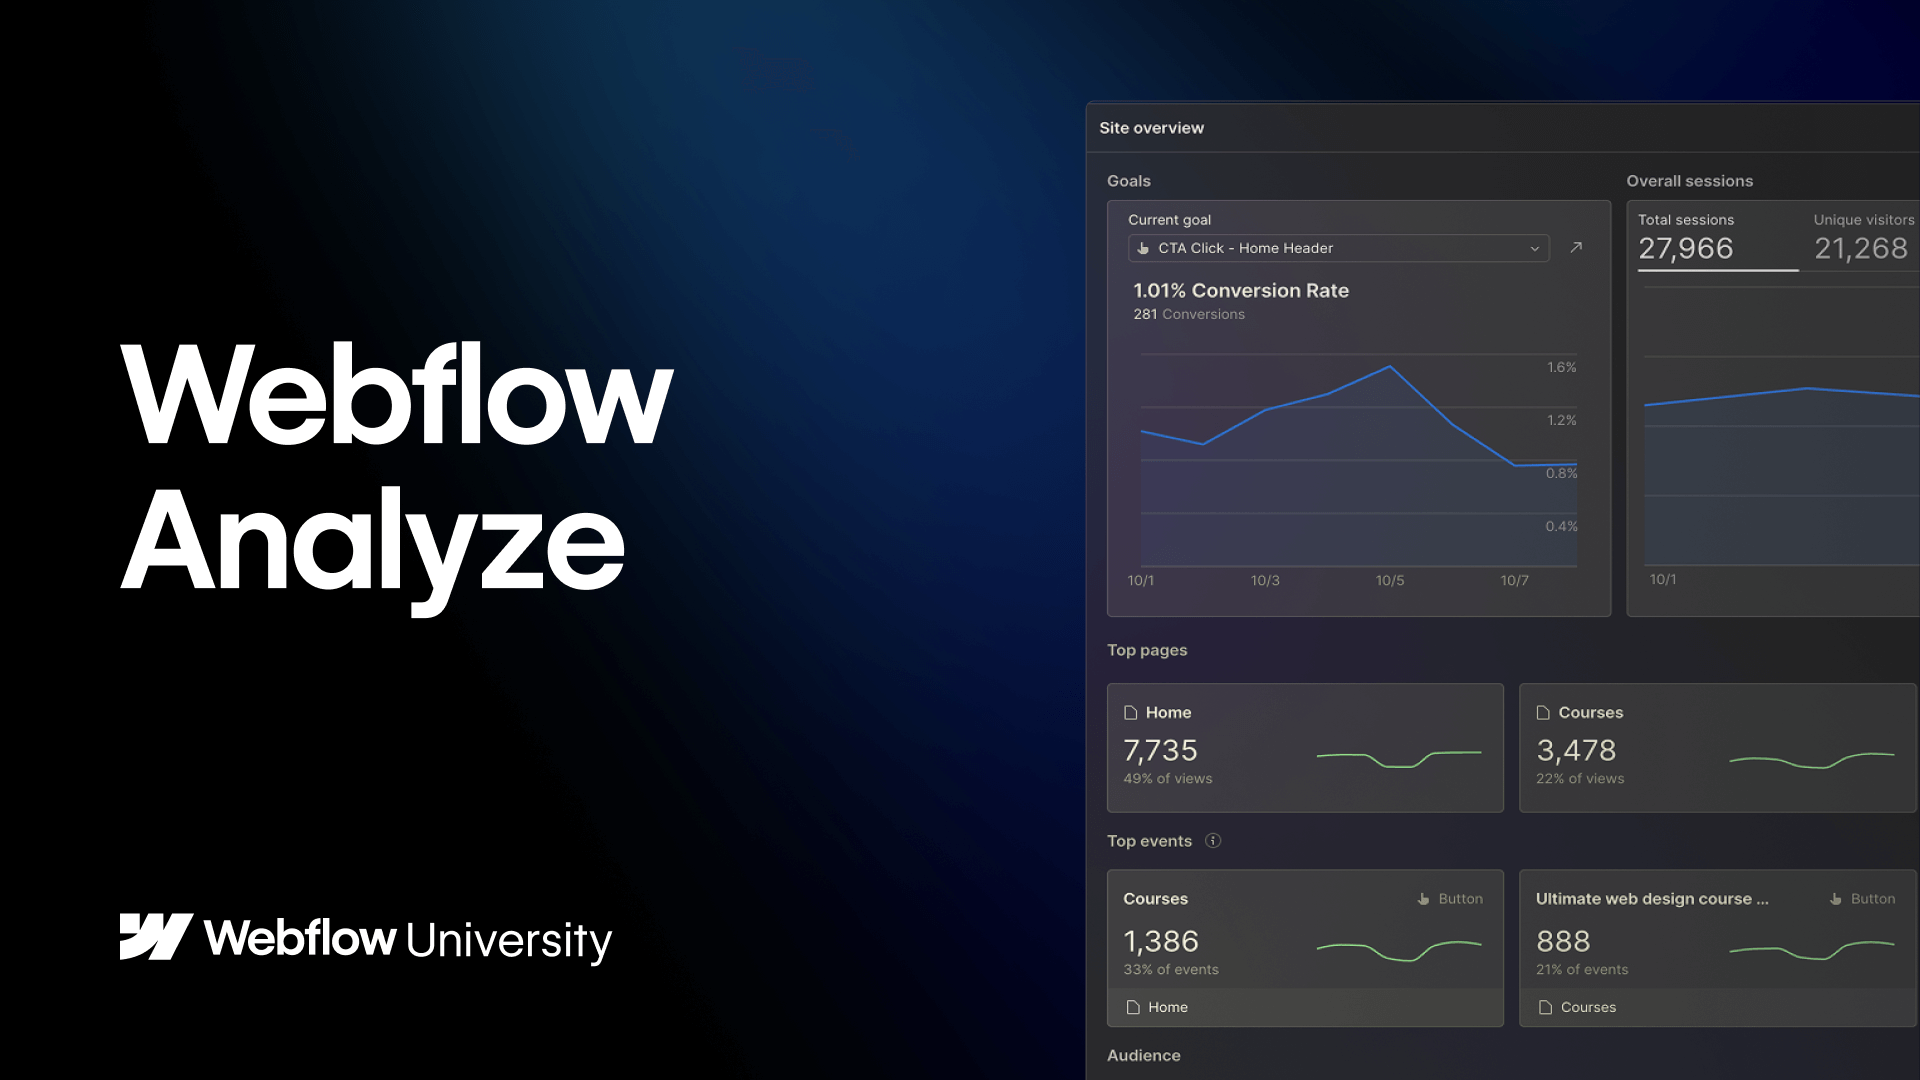
In this lesson, you’ll learn how to download CSV files directly from your charts in Webflow Analyze. See how exports automatically match your filters and date range, include hidden data like time series points, and work across pages, traffic sources, and more.
Whether you’re sharing insights with stakeholders or running your own analysis, this workflow saves time and gives you cleaner, more complete data.
Video transcript
If you’ve ever had to manually pull analyst data into a spreadsheet just to share with a stakeholder or run your own calculations, there is a better way.
Now you can export a CSV directly from Analyze in one click, so you get the data you need in the format you need.
So let’s walk through how it works.
When you hover over any chart in Analyze, you’ll now see an Export to CSV button up here in the top corner. Click it, and your data downloads instantly.
This works across several chart types: time on site, audience cards, pages, page details, and goals. So almost wherever you’re working in Analyze, the option is there.
One thing worth noting: exports are filter-aware. Whatever date range or filters you have applied on screen, that’s exactly what gets exported. So if you’re looking at the last seven days, your CSV will reflect those seven days.
Exporting also surfaces data that isn’t visible in the UI, like the time series sparkline. You can see the trend in the chart, but not the individual data points. When you export it, those data points are all there.
Here’s what that looks like in practice.
On the Pages view, exporting gives you sessions and visitors across all your pages with the active date range applied. And if you dive into a specific chart like traffic sources, you’ll get just that chart’s data: sessions broken down by type, like direct and organic.
Each chart exports on its own, so you’re always downloading exactly what you’re looking at. Nothing more, nothing less.
That’s CSV export in Analyze.